Session Objectives
- Introduction to Plotly
- Scatter Plots
- Line Charts
- Bar Plot
- Bubble Plot
- Box Plot
- Histograms
- Distplots
- Heatmaps
1. Introduction to Plotly
1. Until now we did visualisations using Matplotlib, Seaborn and Pandas. All of them produce
static image files.
2. Plotly is company based out in Canada famous for it's products like Plotly and Dash
3. Plotly creates interactive visualisations in the form of HTML files
4. Drawback- can't work with a live data source
5. Dash is used to create live data based dashboards.
import numpy as np
import pandas as pd
#import plotly.offline as pyo   used for making a new html file
import plotly.express as px
import plotly.graph_objs as go
#pyo.init_notebook_mode(connected=True)
match=pd.read_csv('plotly_data/matches.csv')
delivery=pd.read_csv('plotly_data/deliveries.csv')

ipl=delivery.merge(match,left_on='match_id',right_on='id')
ipl.head()
1. Scatter Plots

# Scatter plots are drawn between to continous variables
# Problem :- We are going to draw a scatter plot between Batsman Avg(X axis) and
# Batsman Strike Rate(Y axis) of the top 50 batsman in IPL(All time)
# Avg vs SR graph of Top 50 batsman(in terms of total runs)

# Fetching a new dataframe with Top 50 batsman
top50=ipl.groupby('batsman')['batsman_runs'].sum().sort_values(ascending=False).head(50).index.tolist()
new_ipl=ipl[ipl['batsman'].isin(top50)]
# Calculating SR
# SR=[(number of runs scored)/(number of balls played)]*100
runs=new_ipl.groupby('batsman')['batsman_runs'].sum()
balls=new_ipl.groupby('batsman')['batsman_runs'].count()

sr=(runs/balls)*100

sr=sr.reset_index()
sr.head()
# Calculating Avg
# Avg=(Total number of Runs)/(Number of outs)

# Calculating number of outs for top 50 batsman
out=ipl[ipl['player_dismissed'].isin(top50)]

nouts=out['player_dismissed'].value_counts()

avg=runs/nouts

avg=avg.reset_index()
avg.rename(columns={'index':'batsman',0:'avg'},inplace=True)

avg=avg.merge(sr,on='batsman')
avg.head()
# Plot Scatter Plot here

trace = go.Scatter(x=avg['avg'], y=avg['batsman_runs'], mode='markers')

data = [trace]

layout = go.Layout(title='Avg vs SR of Top 50 Batsman', xaxis={'title':'Avg'}, yaxis={'title':'SR'})

fig= go.Figure(data=data, layout=layout)

#pyo.plot(fig)
fig.show()
# Year by Year batsman performance

single=ipl[ipl['batsman']=='V Kohli']
performance=single.groupby('season')['batsman_runs'].sum().reset_index()
performance
# Plot Line Chart here

trace = go.Scatter(x=performance['season'], y=performance['batsman_runs'], mode='lines+markers')

data = [trace]

layout = go.Layout(title='Year by Year Performance of Virat Kohli', xaxis={'title':'Season'}, yaxis={'title':'Runs'})
fig = go.Figure(data=data, layout=layout)
fig.show()
# Multiple Line Charts

def batsman_comp(*name):
    data=[]
    for i in name:
        single=ipl[ipl['batsman']==i]
        performance=single.groupby('season')['batsman_runs'].sum().reset_index()

        trace=go.Scatter(x=performance['season'],y=performance['batsman_runs']
                         ,mode='lines + markers',name=i)

        data.append(trace)

    layout=go.Layout(title='Batsman Record Comparator',
                xaxis={'title':'Season'},
                yaxis={'title':'Runs'})

    fig=go.Figure(data=data,layout=layout)
    fig.show()
batsman_comp('V Kohli', 'RG Sharma','DA Warner','MS Dhoni')
top10=ipl.groupby('batsman')['batsman_runs'].sum().sort_values(ascending=False).head(10).index.tolist()
top10_df=ipl[ipl['batsman'].isin(top10)]
top10_score=top10_df.groupby('batsman')['batsman_runs'].sum().reset_index()
top10_score
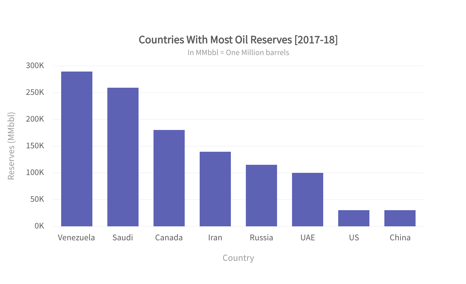
# Plot Bar Graph

trace = go.Bar(x=top10_score['batsman'], y=top10_score['batsman_runs'])

data = [trace]
layout = go.Layout(title='Top 10 Batsman in IPL', xaxis={'title':'Batsman'}, yaxis={'title':'Runs'})
fig = go.Figure(data=data, layout=layout)
fig.show()
There are 2 types of Bar Graphs
1. Nested Bar Graph
2. Stacked Bar Graph
3. Overlayed Bar Graph
iw=top10_df.groupby(['batsman','inning'])['batsman_runs'].sum().reset_index();
mask=iw['inning']==1;
mask2=iw['inning']==2;
one=iw[mask];
two=iw[mask2];


one.rename(columns={'batsman_runs':'1st Innings'},inplace=True);
two.rename(columns={'batsman_runs':'2nd Innings'},inplace=True);

final=one.merge(two,on='batsman')[['batsman','1st Innings','2nd Innings']];

final
# Plot Bar Chart here
trace1 = go.Bar(x=final['batsman'], y=final['1st Innings'], name='1st Innings')
tarce2 = go.Bar(x=final['batsman'], y=final['2nd Innings'], name='2nd Innings')

data = [trace1, tarce2]
layout = go.Layout(title='1st Innings vs 2nd Innings Runs of Top 10 Batsman', xaxis={'title':'Batsman'}, yaxis={'title':'Runs'})
fig = go.Figure(data=data, layout=layout)
fig.show()
# Plot Stacked Bar Chart here
trace1 = go.Bar(x=final['batsman'], y=final['1st Innings'], name='1st Innings')
tarce2 = go.Bar(x=final['batsman'], y=final['2nd Innings'], name='2nd Innings')

data = [trace1, tarce2]
layout = go.Layout(title='1st Innings vs 2nd Innings Runs of Top 10 Batsman', xaxis={'title':'Batsman'}, yaxis={'title':'Runs'})
fig = go.Figure(data=data, layout=layout)

fig.update_layout(barmode='stack')   # Change the bar mode

fig.show()
new_ipl=new_ipl[new_ipl['batsman_runs']==6]

six=new_ipl.groupby('batsman')['batsman_runs'].count().reset_index()

x=avg.merge(six,on='batsman')
x
# Plot Bubble chart here

trace = go.Scatter(x=x['batsman_runs_x'], y=x['batsman_runs_y'], mode='markers', marker=dict(size=x['avg']))

data = [trace]

layout = go.Layout(title='Avg vs SR of Top 50 Batsman', xaxis={'title':'Avg'}, yaxis={'title':'SR'})

fig= go.Figure(data=data, layout=layout)

fig.show()
5. Box Plot
A box and whisker plot—also called a box plot—displays the five-number summary of a set of data.

match_agg=delivery.groupby(['match_id'])['total_runs'].sum().reset_index()
season_wise=match_agg.merge(match,left_on='match_id',right_on='id')[['match_id','total_runs','season']]
season_wise
# Plot Box Plot here

trace = go.Box(x=season_wise['season'], y=season_wise['total_runs'])

data = [trace]

layout = go.Layout(title='Season Wise Runs Distribution', xaxis={'title':'Season'}, yaxis={'title':'Runs'})

fig = go.Figure(data=data, layout=layout)
fig.show()
6. Histograms
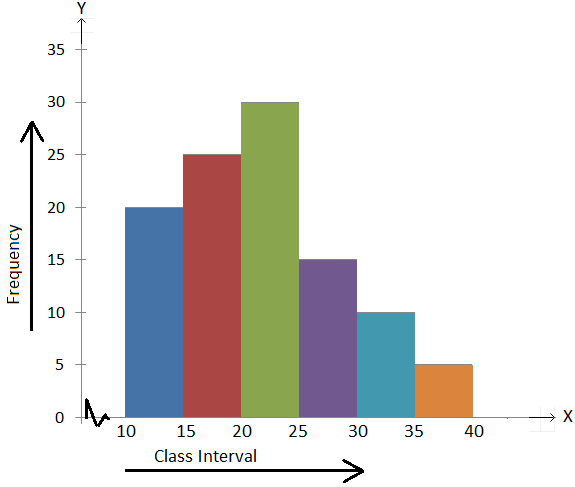
A histogram is a plot that lets you discover, and show, the underlying frequency distribution (shape) of a set of continuous data.

x=delivery.groupby('batsman')['batsman_runs'].count()>150
x=x[x].index.tolist()

new=delivery[delivery['batsman'].isin(x)]


runs=new.groupby('batsman')['batsman_runs'].sum()
balls=new.groupby('batsman')['batsman_runs'].count()

sr=(runs/balls)*100

sr=sr.reset_index()
sr
# Plot Histogram

tarce = go.Histogram(x= sr['batsman_runs'], nbinsx=25)

data = [tarce]

layout = go.Layout(title='Distribution of Strike Rate', xaxis={'title':'SR'}, yaxis={'title':'Count'})

fig = go.Figure(data=data, layout=layout)
fig.show()
7. Distplots

# Plot Distplot

import plotly.figure_factory as ff

hist_data=[avg['avg'], avg['batsman_runs']]

group_labels=['Average', 'Strike Rate']

fig=ff.create_distplot(hist_data,group_labels,bin_size=[6,15])
fig.show()
#pyo.plot(fig)
8. Heatmaps
A heat map is a graphical representation of data where the individual values contained in a matrix are represented as colors.

six=delivery[delivery['batsman_runs']==6]
six=six.groupby(['batting_team','over'])['batsman_runs'].count().reset_index()

six
# Plot Heatmap

trace=go.Heatmap(x=six['batting_team'],y=six['over'],z=six['batsman_runs'])

data=[trace]

layout=go.Layout(title='Six Heatmap')

fig=go.Figure(data=data,layout=layout)
fig.show()
#pyo.plot(fig)
# Side by Side Heatmap

dots=delivery[delivery['batsman_runs']==0]
dots=dots.groupby(['batting_team','over'])['batsman_runs'].count().reset_index()

from plotly import subplots

trace1=go.Heatmap(x=six['batting_team'],y=six['over'],
                 z=six['batsman_runs'].values.tolist())

trace2=go.Heatmap(x=dots['batting_team'],y=dots['over'],
                 z=dots['batsman_runs'].values.tolist())


fig=subplots.make_subplots(rows=1,cols=2,subplot_titles=["6's","0's"], shared_yaxes=True)

fig.append_trace(trace1,1,1)
fig.append_trace(trace2,1,2)

fig.show()
#pyo.plot(fig)
dots
9. Mesh Plots
np.random.seed(1)

N = 70

trace =  go.Mesh3d(x = (70*np.random.randn(N))
                   ,y = (55*np.random.randn(N)),
                     z = (40*np.random.randn(N)),
                     color='rgba(144,220,100,0.4)'
                     )

data = [trace]

layout = go.Layout(title='3D Scatter Plot',
                   scene = dict(xaxis = dict(nticks=4, range=[-100,100],),
                                yaxis = dict(nticks=4, range=[-100,100],),
                                zaxis = dict(nticks=4, range=[-100,100],)),
                                width=1000,
                                height=700,
                                margin=dict(r=20, l=10, b=10, t=10)
                                )

fig = go.Figure(data=data, layout=layout)
fig.show()

